MySQL Performance Schema&sys Schema介绍
试图解决如下问题
sys schema和PS是干什么的?两者什么关系?怎么用?
PS有哪些常见用途?
PS的default选项是什么?
简介
Performance Schema是对MySQL Server的一种更细力度的性能监控诊断工具,类似linux Perf,通过在代码中加入很多的instrument,来监控各种event的时间消耗,比如改表各个阶段的时间消耗、一条SQL执行过程中各个阶段的时间消耗,包括下面特征:
- 使用performance_schema引擎,并且独立的performance_schema数据库;
- PS(后面指代Performance Schema)监控server events,event包括了在服务器端消耗时间,包括函数调用、OS wait、SQL执行的某个阶段(比如解析、排序、整个SQL执行过程);可以通过PS监控同步调用文件、IO、lock;
- 只会在当前实例中存在,不会记录在binlog中,也不会同步给slave;
- performance_schema中的表是view或者临时表,不会持久化;
PS Variable和Status
PS相关的variable performance_schema不是动态的,默认是打开的;从5.7.8开始,即使PS是关闭的,其中global_variables, session_variables, global_status, session_status 这些表还是会生产数据,目的是为了show variable和show status可以从这些表中获取数据。
PS包括很多variable用于限制PS,比如performance_schema_max_mutex_classes默认200,如果创建超过200的instrumented mutex instance,则不能继续创建。如果引发这种限制之后会增加相应的status,比如上面例子会增加Performance_schema_mutex_instances_lost。
PS包括非常多的可以自定义限制条件的variable,也包括了很多对应status,可以通过下面语句查看。
SHOW STATUS LIKE 'perf%';
SHOW global variables LIKE 'perf%';
PS Setup tables
PS通过位与Performance_schema库下的多个setup表来控制对哪些event来监控,下面会逐个介绍:
通过setup_instruments表(1050个event)控制打开哪些event;
mysql> UPDATE setup_instruments SET ENABLED = 'YES', TIMED = 'YES';
Query OK, 560 rows affected (0.04 sec)
mysql> UPDATE setup_consumers SET ENABLED = 'YES';
Query OK, 10 rows affected (0.00 sec)
PS通过收集event来更新performance_schema中表,这些表表现为event信息的消费者,通过setup_consumers来控制。setup_consumers控制的表包括下面的表
mysql> select * from setup_consumers;
+----------------------------------+---------+
| NAME                             | ENABLED |
+----------------------------------+---------+
| events_stages_current            | NO      |
| events_stages_history            | NO      |
| events_stages_history_long       | NO      |
| events_statements_current        | YES     |
| events_statements_history        | YES     |
| events_statements_history_long   | NO      |
| events_transactions_current      | NO      |
| events_transactions_history      | NO      |
| events_transactions_history_long | NO      |
| events_waits_current             | NO      |
| events_waits_history             | NO      |
| events_waits_history_long        | NO      |
| global_instrumentation           | YES     |
| thread_instrumentation           | YES     |
| statements_digest                | YES     |
+----------------------------------+---------+
15 rows in set (0.00 sec)
setup_consumers表有依赖关系,比如说只有当global_instrumentation为YES时,才会检查其他的设置,具体的依赖关系如下:
global_instrumentation
 thread_instrumentation
   events_waits_current
     events_waits_history
     events_waits_history_long
   events_stages_current
     events_stages_history
     events_stages_history_long
   events_statements_current
     events_statements_history
     events_statements_history_long
   events_transactions_current
     events_transactions_history
     events_transactions_history_long
 statements_digest
setup_timers表定义不同的event group采用的时间精度,默认的时间精度选择主要是在性能和准确性之间进行权衡。其中cycle的消耗最少,但是会受到cpu频率的影响(很多笔记本电脑会随着温度和当前负载动态调整频率),因此将cycle转化成时间的时候会不准确;而采用毫秒或者纳秒的,会消耗更多的cpu。
mysql> select * from setup_timers;
+-------------+-------------+
| NAME        | TIMER_NAME  |
+-------------+-------------+
| idle        | MICROSECOND |
| wait        | CYCLE       |
| stage       | NANOSECOND  |
| statement   | NANOSECOND  |
| transaction | NANOSECOND  |
+-------------+-------------+
5 rows in set (0.00 sec)

mysql> SELECT * FROM performance_timers;
+-------------+-----------------+------------------+----------------+
| TIMER_NAME  | TIMER_FREQUENCY | TIMER_RESOLUTION | TIMER_OVERHEAD |
+-------------+-----------------+------------------+----------------+
| CYCLE       |      2193995024 |                1 |             30 |
| NANOSECOND  |      1000000000 |                1 |             63 |
| MICROSECOND |         1000000 |                1 |             58 |
| MILLISECOND |            1037 |                1 |             58 |
| TICK        |             107 |                1 |           1182 |
+-------------+-----------------+------------------+----------------+
5 rows in set (0.00 sec)
即使不同的event group采用不同的时间精度,但是在展示的时候都统一转化成皮秒Picosecond(尽可能的不损失精度,而且乘法比除法效率更高)。
比如events_waits_current/events_stages_current/events_statements_current/events_transactions_current 4张表的TIMER_START、TIMER_END、TIMER_WAIT、LOCK_TIME单位都是皮秒,注意TIMER_START和TIMER_END都是相对与MySQL服务刚启动时而言的。
setup_objects表配置决定是否打开某些表或者database的相关event、function、procedure、table、trigger的event监控;默认关闭mysql、performance_schema、information_schema三个系统database的event监控。
threads表配置是否打开某些thread的event监控。
setup_actors表配置是否打开针对某些用户的event监控。
PS Instrument分类以及命名
PS Instrument分为下面几大类,命名方式按照从抽象到具体的原则,使用/分隔,比如“stage/innodb/alter table (flush)”、“stage/sql/Waiting for table metadata lock”。
- idle
- memory,大部分默认是关闭的,按照memory/code_area/instrument_name这样的命名格式。
- stage,表示语句执行的不同阶段,命名格式stage/code_area/stage_name,其中stage_name来自show processlist,默认只打开了alter table和coping tmp table;比如说atler table的几个阶段,其中
- stage/innodb/alter table (end)
- stage/innodb/alter table (log apply index)
- stage/innodb/alter table (read PK and internal sort)
- statement,按照语句的分类来进行监控,默认全部打开;比如下面这些
- statement/sql/delete
- statement/sql/drop_table
- statement/com/Drop DB
- wait,包括线程同步相关的event,比如wait/synch/mutex、wait/synch/rwlock、wait/synch/cond;io相关event,比如wait/io/file/sql/LOAD_FILE、wait/io/file/innodb/innodb_data_file、wait/io/file/sql/binlog;lock相关的event,比如wait/lock/table、wait/lock/metadata/sql/mdl。
PS 表分类以及用途
- Setup tables,上面已经详细介绍;
- current events tables,命名:xxx_current,表示当前每一个连接最近的一个event;
- history tables,命名:xxx_history,表示当前每一个连接最近的10个event;可以通过类似
performance_schema_events_waits_history_size参数进行修改; - history long tables,命名:xxx_history_long,表示当前每一个连接最近的10000个event;可以通过类似
performance_schema_events_waits_history_long_size进行修改; - summary tables,命名:xxx_summary_by_xxx,表示针对某种event以某种纬度的统计;比如events_statements_summary_by_digest,对statement按照digest进行统计诸如SUM_ROWS_SENT、SUM_ROWS_EXAMINED、SUM_LOCK_TIME、SUM_NO_INDEX_USED等指标;
- instance tables,命名:xxx_instances,表示针对某种类型的资源(比如file、rwlock、mutex)当前的使用情况;
- 其他表,比如metadata_locks表,表示metadatalock的持有情况
- users/hosts/accounts分别以这些纬度来统计当前的连接以及历史全部连接数。
其中xx_stages_xx类型的表,是按照各个阶段来进行划分的,比如类似stage/sql/allocating local table、stage/sql/preparing for alter table、stage/sql/committing alter table to storage engine,可以通过阶段耗时来定位问题。
其中xx_statements_xx类型的表,是和语句相关,可以通过这些表查看语句相关的信息,比如ROWS_SENT、ROWS_EXAMINED、LOCK_TIME、NO_INDEX_USED等;
PS下面的表只能应用有限的一些权限,比如select、update、drop(用于truncate,清空已有的信息),因此不能授权ALL给ps下面的表。
关于performance schema的用法,可以参照这个PPT,写的非常详细。
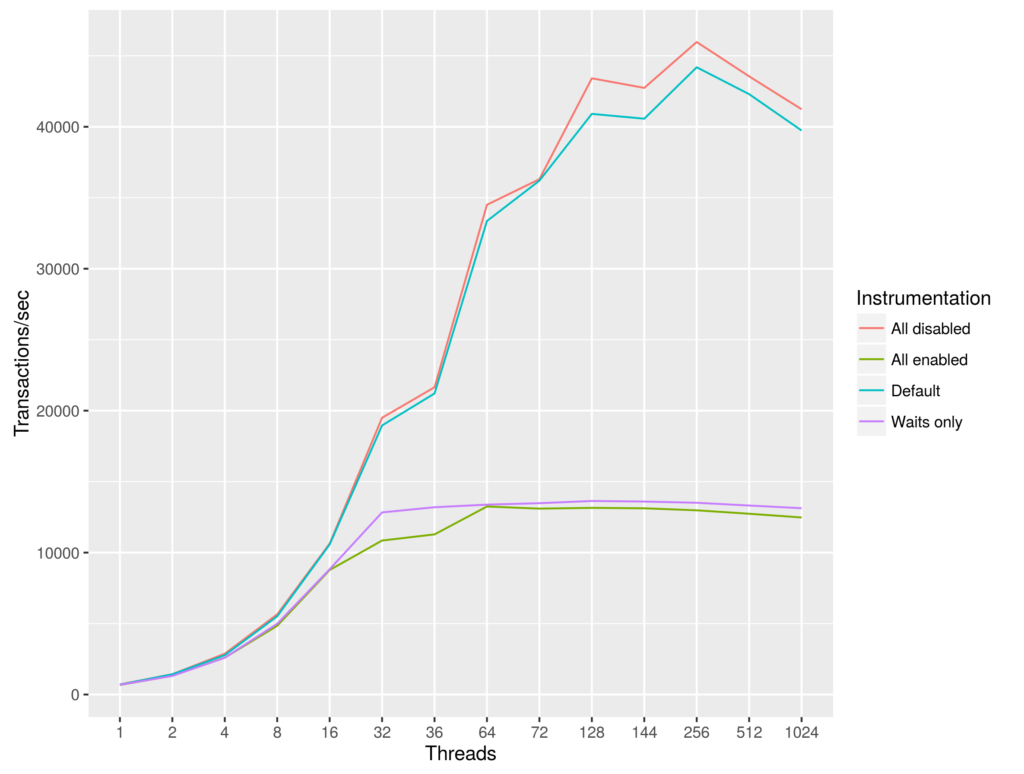
关于performance schema对与性能的影响可以查看Sveta Smirnova的性能测试(和上面提到的PS用法的PPT是一个作者),5.7中Default选项对与性能的影响完全在可接受的范围内。
用途
感觉PS太底层和复杂了,调查问题起来很不方便;建议使用上层抽象sys schema替代。
- 使用performance_schema查看metadatalock的信息,Percona博客写的很清楚,不在赘述。
- 使用INNODB_LOCK_WAITS、INNODB_TRX、INNODB_LOCKS三张表去查询锁等待问题很方便,但是这三张表在8.0会被去掉,通过使用PS中的表来代替,但是还没有找到相应的方法,😭。
sys Schema
从5.7.7开始MySQL引入sys schema,包含一些自定义触发器、view、存储过程、函数,数据来自于performance_schema和information_schema,为DBA和DEV提供方便。可以通过这些view查看分别以host、statement、user、schema、table、io、memory纬度的统计信息,对与DBA和DEV都非常实用,比如查看host来源分布、statement(sort、95响应时间、全表扫描、响应时间)。
其中sys Schema看到的大部分表都是view,view分为两种,一种以”x$“开头。以”x$”开头的view包含原始数据;而没有以”x$”开头的view,将原始数据应用这四个方法来增加可读性,format_bytes()、format_time()、format_statement()、format_path(),比如说将byte根据大小转化成m、g、pb等。sys schema总共101张表,大部分都是有x$开头的原始数据表;除去原始数据表,总共53张表,都非常实用。
具体的view、Procedures、functions如下:
Table 25.2 sys Schema Views
Table 25.3 sys Schema Stored Procedures
| Procedure Name | Description |
|---|---|
create_synonym_db() | Create synonym for schema |
diagnostics() | Collect system diagnostic information |
execute_prepared_stmt() | Execute prepared statement |
ps_setup_disable_background_threads() | Disable background thread instrumentation |
ps_setup_disable_consumer() | Disable consumers |
ps_setup_disable_instrument() | Disable instruments |
ps_setup_disable_thread() | Disable instrumentation for thread |
ps_setup_enable_background_threads() | Enable background thread instrumentation |
ps_setup_enable_consumer() | Enable consumers |
ps_setup_enable_instrument() | Enable instruments |
ps_setup_enable_thread() | Enable instrumentation for thread |
ps_setup_reload_saved() | Reload saved Performance Schema configuration |
ps_setup_reset_to_default() | Reset saved Performance Schema configuration |
ps_setup_save() | Save Performance Schema configuration |
ps_setup_show_disabled() | Display disabled Performance Schema configuration |
ps_setup_show_disabled_consumers() | Display disabled Performance Schema consumers |
ps_setup_show_disabled_instruments() | Display disabled Performance Schema instruments |
ps_setup_show_enabled() | Display enabled Performance Schema configuration |
ps_setup_show_enabled_consumers() | Display enabled Performance Schema consumers |
ps_setup_show_enabled_instruments() | Display enabled Performance Schema instruments |
ps_statement_avg_latency_histogram() | Display statement latency histogram |
ps_trace_statement_digest() | Trace Performance Schema instrumentation for digest |
ps_trace_thread() | Dump Performance Schema data for thread |
ps_truncate_all_tables() | Truncate Performance Schema summary tables |
statement_performance_analyzer() | Report of statements running on server |
table_exists() | Whether a table exists |
| Procedure Name | Description |
|---|---|
Table 25.4 sys Schema Stored Functions
| Function Name | Description |
|---|---|
extract_schema_from_file_name() | Extract schema name from file path name |
extract_table_from_file_name() | Extract table name from file path name |
format_bytes() | Convert byte value to value with units |
format_path() | Replace data and temp-file directories in path name with symbolic values |
format_statement() | Truncate long statement to fixed length |
format_time() | Convert picoseconds value to value with units |
list_add() | Add item to list |
list_drop() | Remove item from list |
ps_is_account_enabled() | Check whether account instrumentation is enabled |
ps_is_consumer_enabled() | Check whether consumer is enabled |
ps_is_instrument_default_enabled() | Check whether instrument is enabled |
ps_is_instrument_default_timed() | Check whether instrument is timed |
ps_is_thread_instrumented() | Check whether thread is instrumented |
ps_thread_account() | Return account for thread ID |
ps_thread_id() | Return thread ID for connection ID |
ps_thread_stack() | Return event information for thread ID |
ps_thread_trx_info() | Return transaction information for thread ID |
quote_identifier() | Return string as quoted identifier |
sys_get_config() | Return sys schema configuration option |
version_major() | MySQL server major version number |
version_minor() | MySQL server minor version number |
version_patch() | MySQL server patch release version number |
view的数据来源于performance schema或者information schema,以statements_with_full_table_scans为例子来说明,既然statements_with_full_table_scans是view,那我们可以通过它的定义来知晓它的原理和数据来源,定义通过查看github上源码来确定,该view在,views/p_s/statements_with_full_table_scans.sql中定义。定义太长不贴出来了,通过定义可以看到statements_with_full_table_scans来自于performance_schema.events_statements_summary_by_digest。
最快速了解这表的用途的方法,就是执行一些杂乱的SQL,然后去观察sys schema中各个表中的数据。
mysql sys -e "select TABLE_NAME from information_Schema.tables where TABLE_SCHEMA='sys' and TABLE_NAME not like 'x%';" -B -N >tables

cat tables|while read table;do echo "----------------------- $table";mysql sys -e"select * from $table limit 3;";done;
默认的performance schema设置下,sys schema大部分表都是可以使用的,目前只发现schema_table_lock_waits、latest_file_io表不可以用。
其中schema_table_lock_waits依赖于performance_schema.metadata_locks,而performance_schema.metadata_locks默认是不打开的,需要执行下面语句打开:
UPDATE performance_schema.setup_instruments SET ENABLED = 'YES' WHERE NAME = 'wait/lock/metadata/sql/mdl';
latest_file_io依赖于performance_schema.events_waits_history_long,默认也是关闭的,通过setup_consumers打开。